
Why Two Radiation Instruments Can Give Different Readings
Compare radiation instruments by quantity, configuration, geometry and timing. A structured comparison helps explain differences without averaging incompatible readings.
Open the concept graphic at full size ↗
Three key ideas
Compare the measurement, then the number
- Quantity: Check what each displayed unit represents.
- Conditions: Align geometry, timing and configuration.
- Response: Review calibration and remaining uncertainty.
At a glance
A practical comparison
| Observation | What it tells you | What else you need |
|---|---|---|
| Counts/s versus µSv/h | Different measurement outputs | A task-specific response model, not a simple unit change |
| Same unit, different positions | Different field observations | Reference position and shielding context |
| Same quantity and arrangement | A potentially meaningful comparison | Response characteristics and uncertainty |
Educational comparison; apply the method specified for the instrument and task.
Two numbers do not form a valid comparison merely because both come from radiation instruments. Before investigating a fault, establish whether the instruments are observing the same thing in the same way.
Start with the quantity and configuration
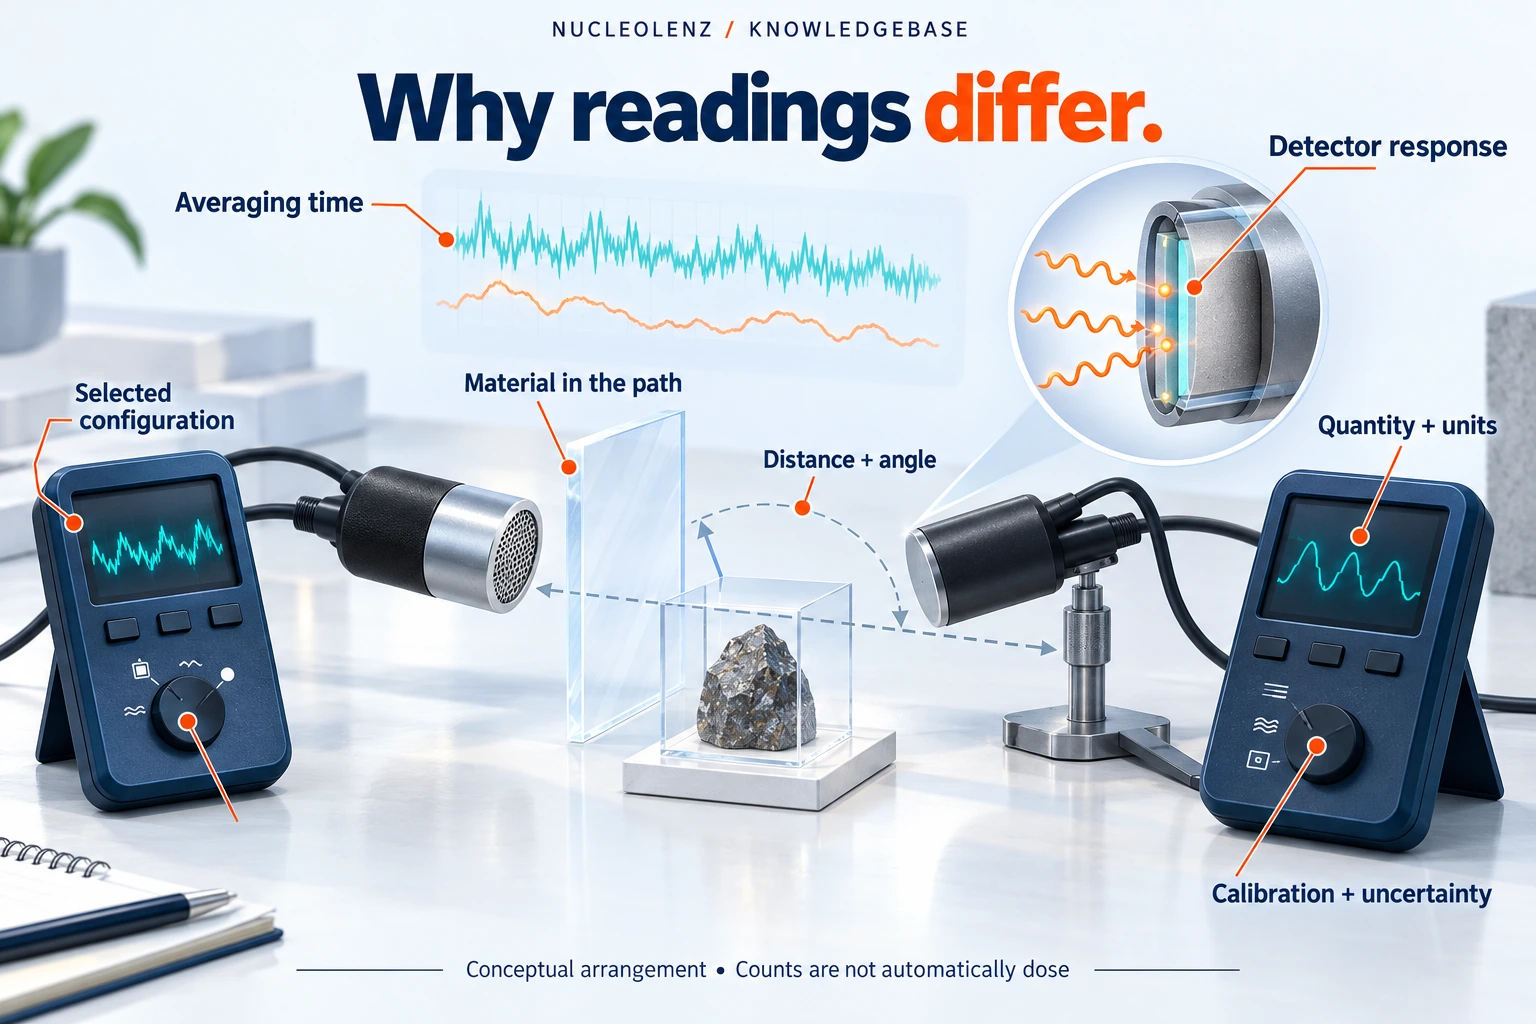
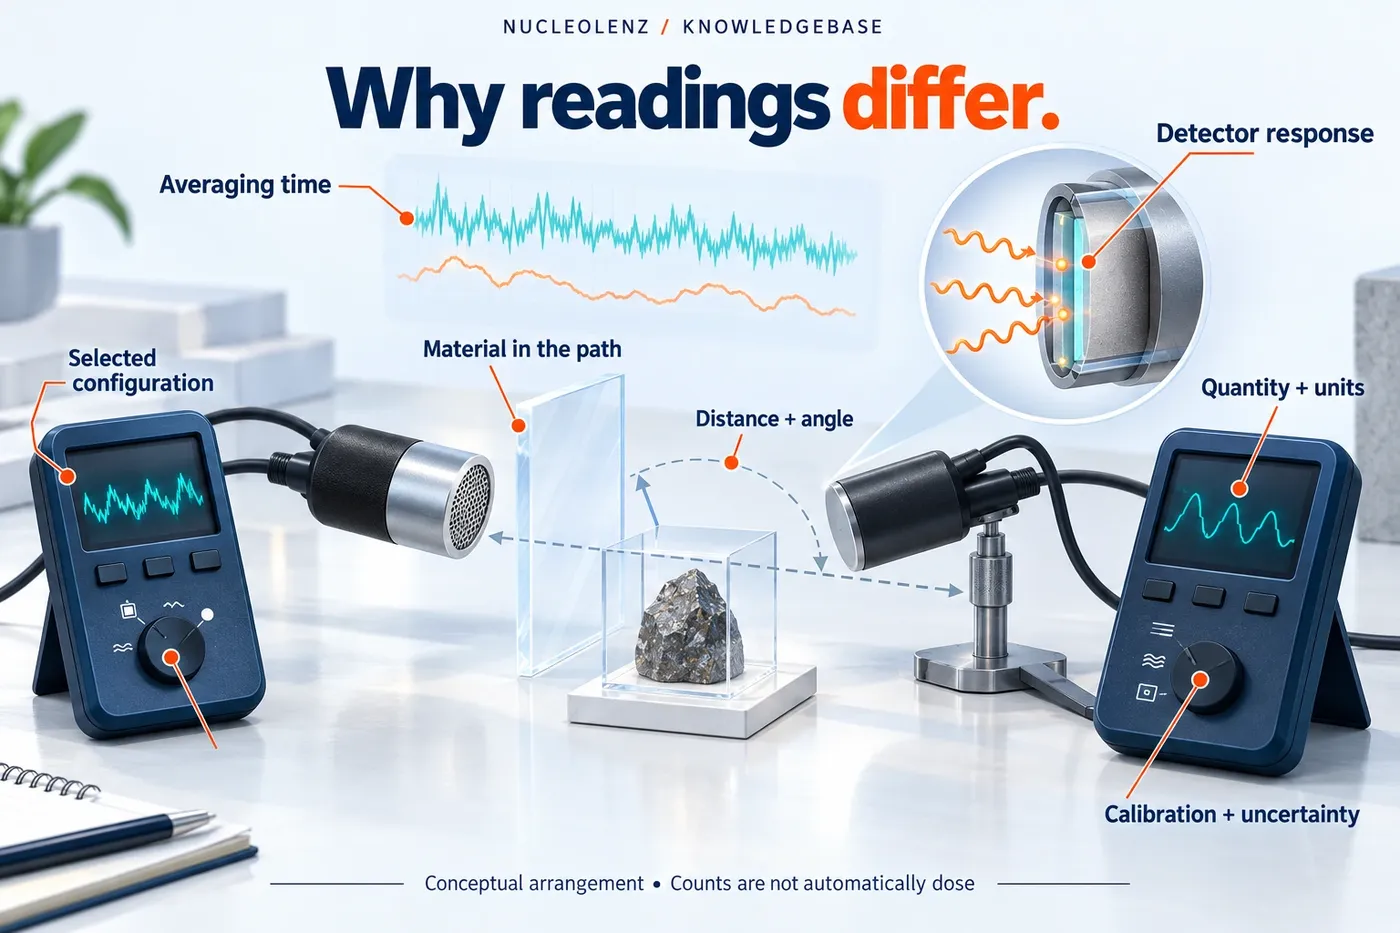
A count rate, a dose-equivalent rate and an energy spectrum describe different outputs. Even displays with similar units can respond differently to energy and direction. Read the instrument's intended measurement quantity, detector configuration and calibration information before comparing values.
Do not assume that a shared connector or a familiar probe shape makes two systems equivalent. An instrument and an external detector may need specific settings and calibration as a combination.
Make the comparison controlled
Define the detector reference positions, orientation, acquisition time and source conditions. Record any shielding or covering. Check whether one display is still responding to a recent change while the other has already stabilized.
Investigate the remaining difference
When the quantities and conditions match, consider the stated response characteristics and measurement uncertainties. A calibration certificate supports the conditions it describes; it does not prove identical response in every radiation field. Persistent unexplained discrepancies should be investigated through the approved technical or radiation protection process.
The Nucleolenz Gamma Spectrometer T200 is described with dose/count displays and an energy-level reading capability. A user comparing its outputs with another instrument should identify the specific mode and configuration, and the measurement quantity supported by that mode.
Keep the original records, including the settings that seemed unimportant at the time. A useful comparison produces a traceable explanation of the difference, not just an average of two unexplained numbers.
A disagreement that disappears when the labels return
Imagine two fictional survey records from the same room. Instrument A reports counts per second and instrument B reports microsieverts per hour. A spreadsheet has removed the units and placed both numbers in a column called radiation. The first correction is to restore the quantities, not adjust either meter until their numbers match. A count-to-dose conversion requires the appropriate detector response and radiation conditions; it is not a universal unit conversion.
Now suppose both instruments report the same dose-equivalent-rate quantity. A second worksheet shows that one detector was beside a shield and the other was in front of it. The readings still do not constitute a controlled comparison. Moving through the explanation in this order prevents a geometry difference from being mistaken for a calibration fault.
Build a comparison record in pairs
- Quantity and unit: Copy the full displayed mode and calibration quantity for each system.
- Meter and detector: Record both identities, their approved pairing and any relevant configuration reference.
- Position and time: Identify each detector's reference point, orientation and acquisition interval.
- Response evidence: Compare the applicable energy range, response time, calibration conditions and uncertainty.
The result may be that the instruments are suitable for different purposes. That is useful information. Do not choose the lower reading merely because it is convenient, or the higher reading as a substitute for understanding an unexplained difference. The responsible reviewer needs the actual observations and their context.
When a discrepancy remains unresolved, retain both readings with an explicit investigation status. A later repair or recalibration can inform the review of earlier data, but should not silently replace the earlier measurement history.
Include overload or fault indications, too; an out-of-range display is not a valid low reading.
Check your understanding
Put the idea to work
Choose an answer, then reveal the explanation. Your answers stay in this browser.