
Environmental Radiation Monitoring Starts With a Baseline
Build environmental radiation trends around a documented baseline. Consistent locations, units, intervals and equipment records help distinguish a real change from a change in method.
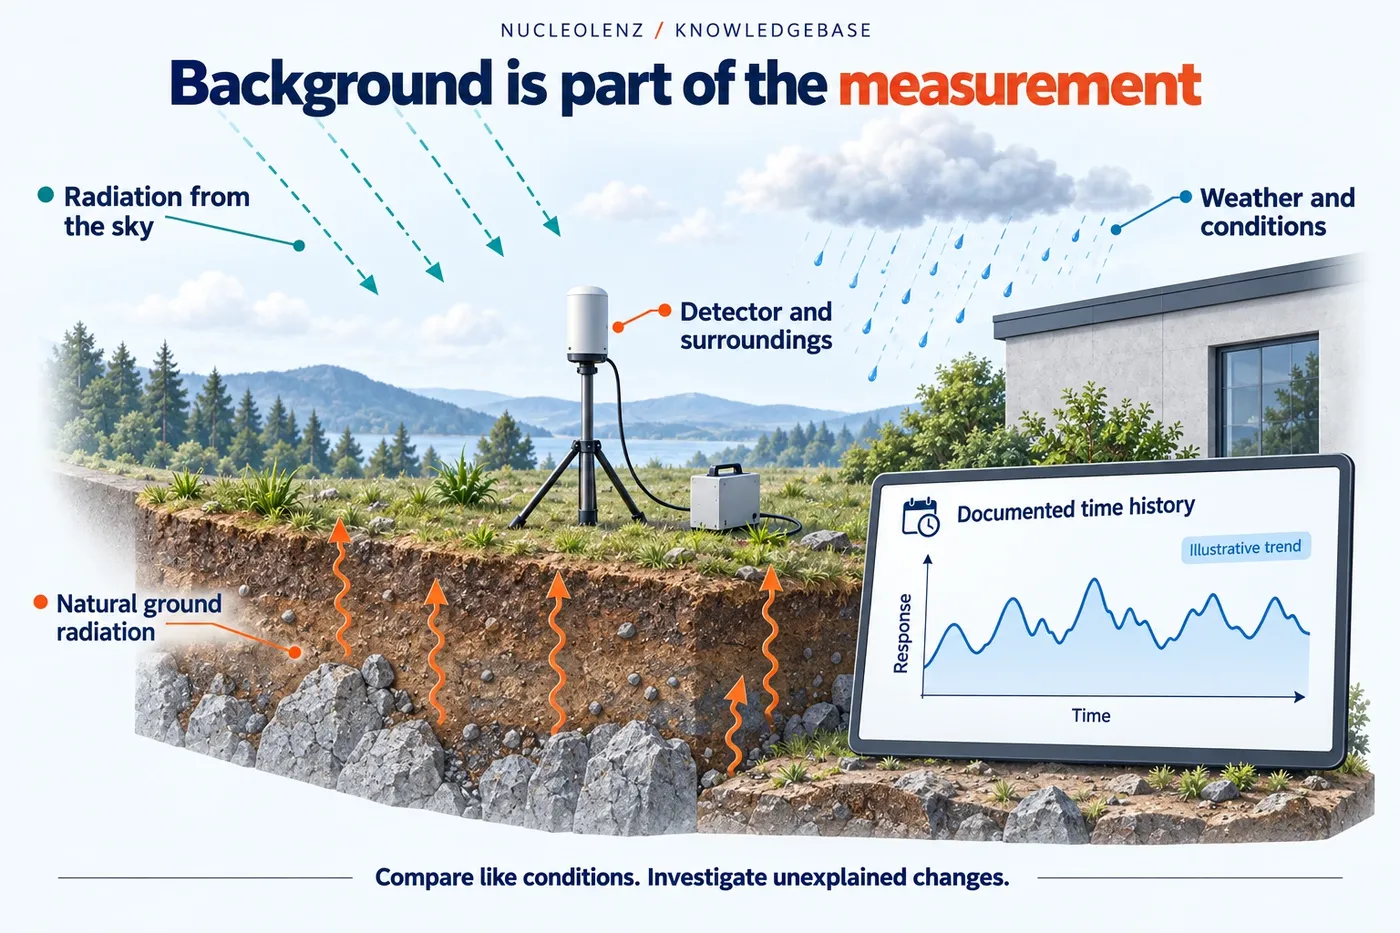
Open the concept graphic at full size ↗
Three key ideas
A baseline is a documented pattern
- Define: Quantity, location and reporting interval.
- Observe: Retain values, status and relevant conditions.
- Compare: Investigate changes with the method history.
At a glance
A practical comparison
| Observation | What it tells you | What else you need |
|---|---|---|
| Field monitoring series | A trend for a supported quantity at a station | Stable definitions and instrument status |
| Collected sample result | A result for a medium and collection period | Collection and laboratory records |
| Missing observation | No usable value for that interval | Reason for the gap and any follow-up |
| Changed installation | A possible break in comparability | Placement history and continuity assessment |
Educational comparison; apply the method specified for the instrument and task.
A single environmental reading has limited context. A baseline describes the pattern observed under defined conditions and gives later measurements a meaningful reference.
Define what the baseline covers
Choose the quantity, locations, time intervals and measurement methods before collecting a trend. Field monitoring and laboratory analysis of collected samples produce different information. State what each series represents instead of combining unlike quantities on one unexplained chart.
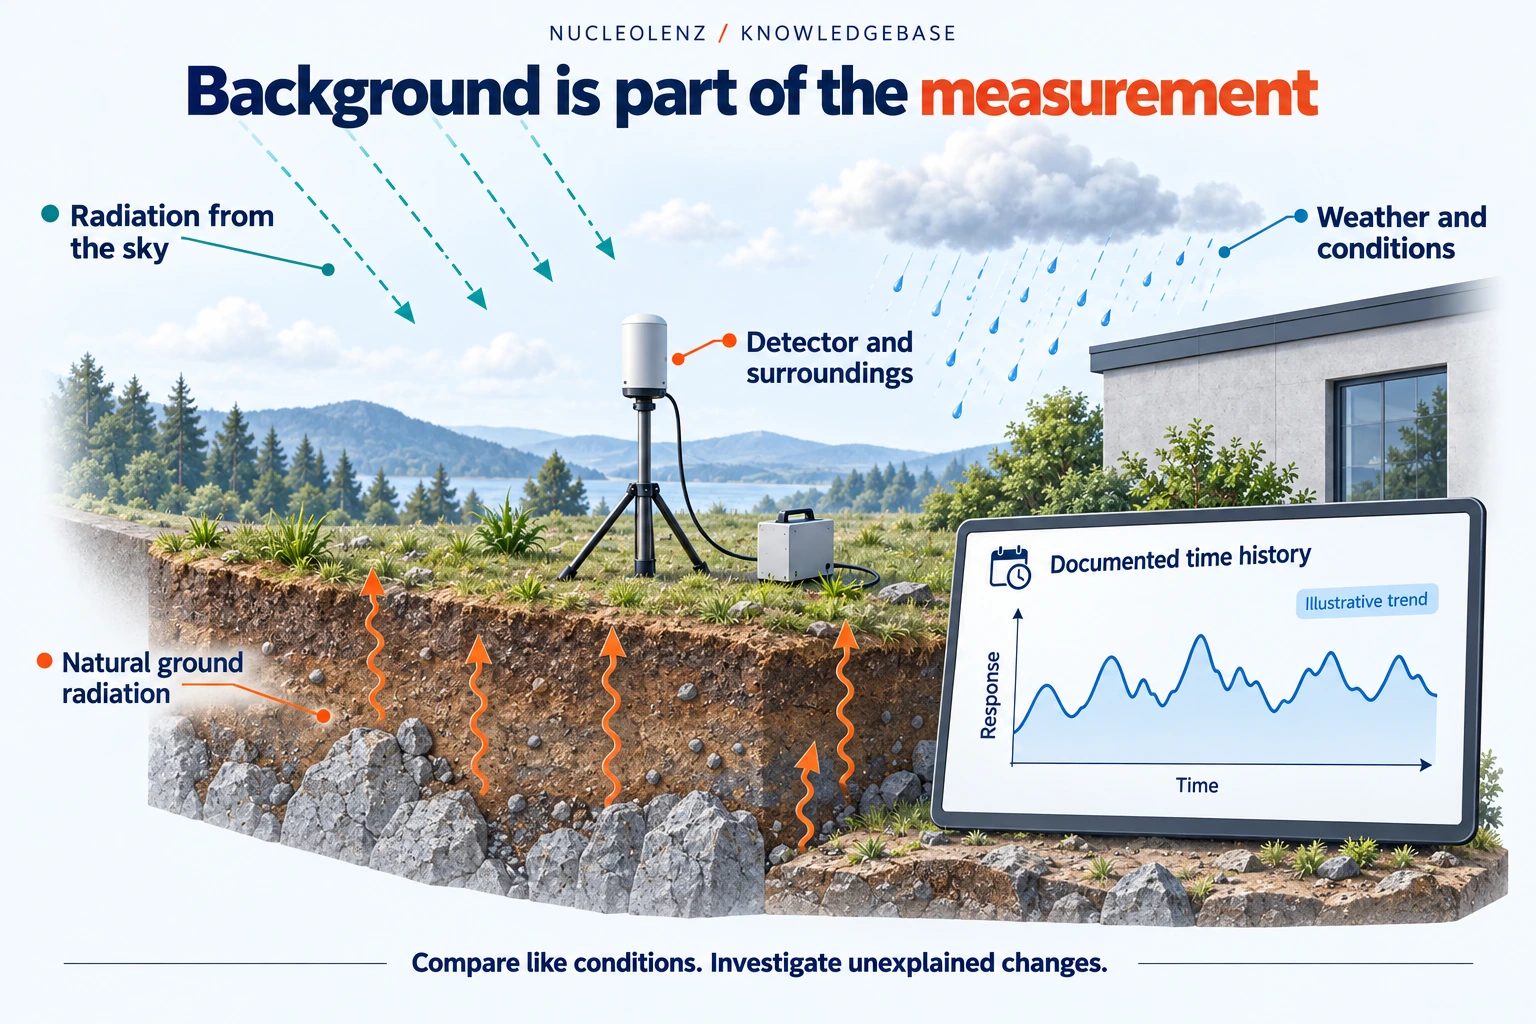
Natural background is present, and environmental conditions can change. A baseline should therefore describe observations over relevant conditions rather than imply that one initial reading is a permanent reference.
Keep the method consistent and visible
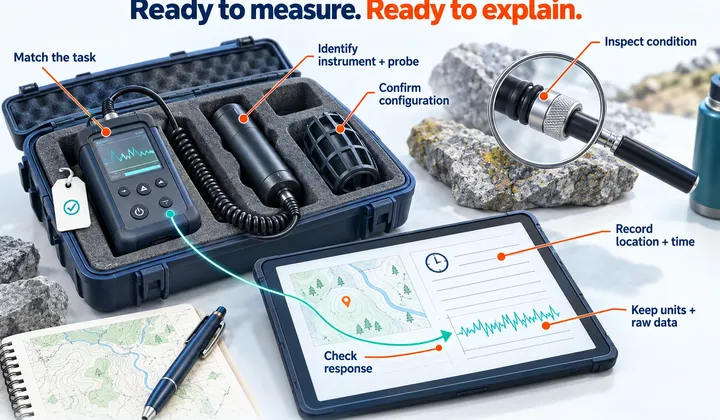
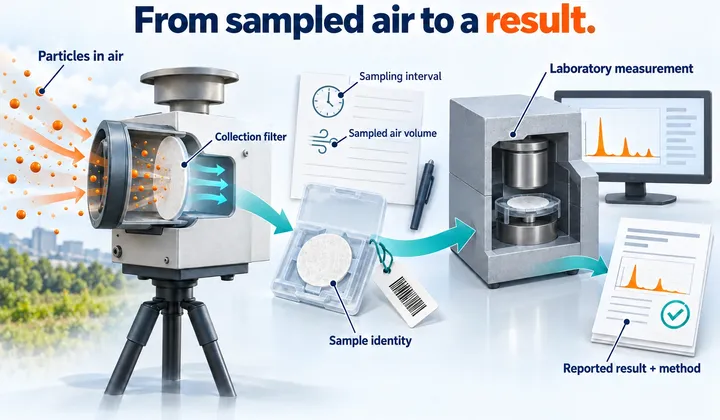
Record the instrument and detector, configuration, position, acquisition interval and status information. For sampling, preserve sample identity, collection period and relevant volume or method records. Document a change in equipment or method so that it is not mistaken for a change in the environment.
Investigate a change before assigning a cause
Check whether instrument status, site activity, position or processing changed. Preserve the original observation and use the appropriate investigation method. A change in total counts is not, by itself, an identified radionuclide or a dose assessment.
Nucleolenz's Outdoor Area Gamma Monitor and Air Sampler Y2 illustrate fixed-field monitoring and particulate collection as different workflows. Selection and interpretation must be tied to a specific monitoring plan; sampling requires the appropriate subsequent analysis.
A baseline becomes useful when its scope and limitations are explicit. Keep those definitions with the data, so that a later reviewer knows which comparisons are supported and which require a new assessment or method.
Two trend changes with different explanations
In a fictional monitoring log, a step change appears on the day a detector moves from a wall to an open yard. A second change appears during heavy rain with no equipment move. Both observations deserve context, but they should not be given the same explanation automatically. The first coincides with a change in geometry and surroundings; the second may involve environmental variation or another cause requiring investigation.
EPA describes how precipitation can alter natural background, including temporary increases associated with radon decay products brought to the ground. Weather is therefore useful supporting information, not proof that any particular excursion is harmless or weather-related. Retain the observation and apply the monitoring programme's review process.
Write a baseline specification before the chart
- Series definition: State the measured quantity, units, station and detector reference position.
- Time definition: State the acquisition or reporting interval, time zone and treatment of missing data.
- Equipment history: Identify configuration, calibration, maintenance and replacement events.
- Environmental context: Record the site or weather information relevant to interpreting that series.
A gap caused by lost power is a gap, not a measured zero. A change in averaging interval can make peaks look smaller even when the underlying short observations are unchanged. Keep these changes visible on the timeline so a reviewer can distinguish data processing from environmental behaviour.
Keep field and sample evidence connected
A field trend can show when an observation changed; a laboratory sample can address a different quantity over its collection interval. Their timestamps, units and methods should remain explicit when they are discussed together. Do not place a sample concentration and a field count rate on one axis without explaining their distinct meanings.
A baseline supports comparison within its defined scope. When the station, instrument or purpose changes, assess whether continuity is still supported and document the decision rather than quietly joining unlike records into a single trend.
Check your understanding
Put the idea to work
Choose an answer, then reveal the explanation. Your answers stay in this browser.