
Reading Your First Gamma Spectrum: Axes, Peaks and Background
Read a gamma spectrum by checking its axes, acquisition conditions, peaks and background. A worked interpretation exercise shows what a plot can establish and what remains unknown.
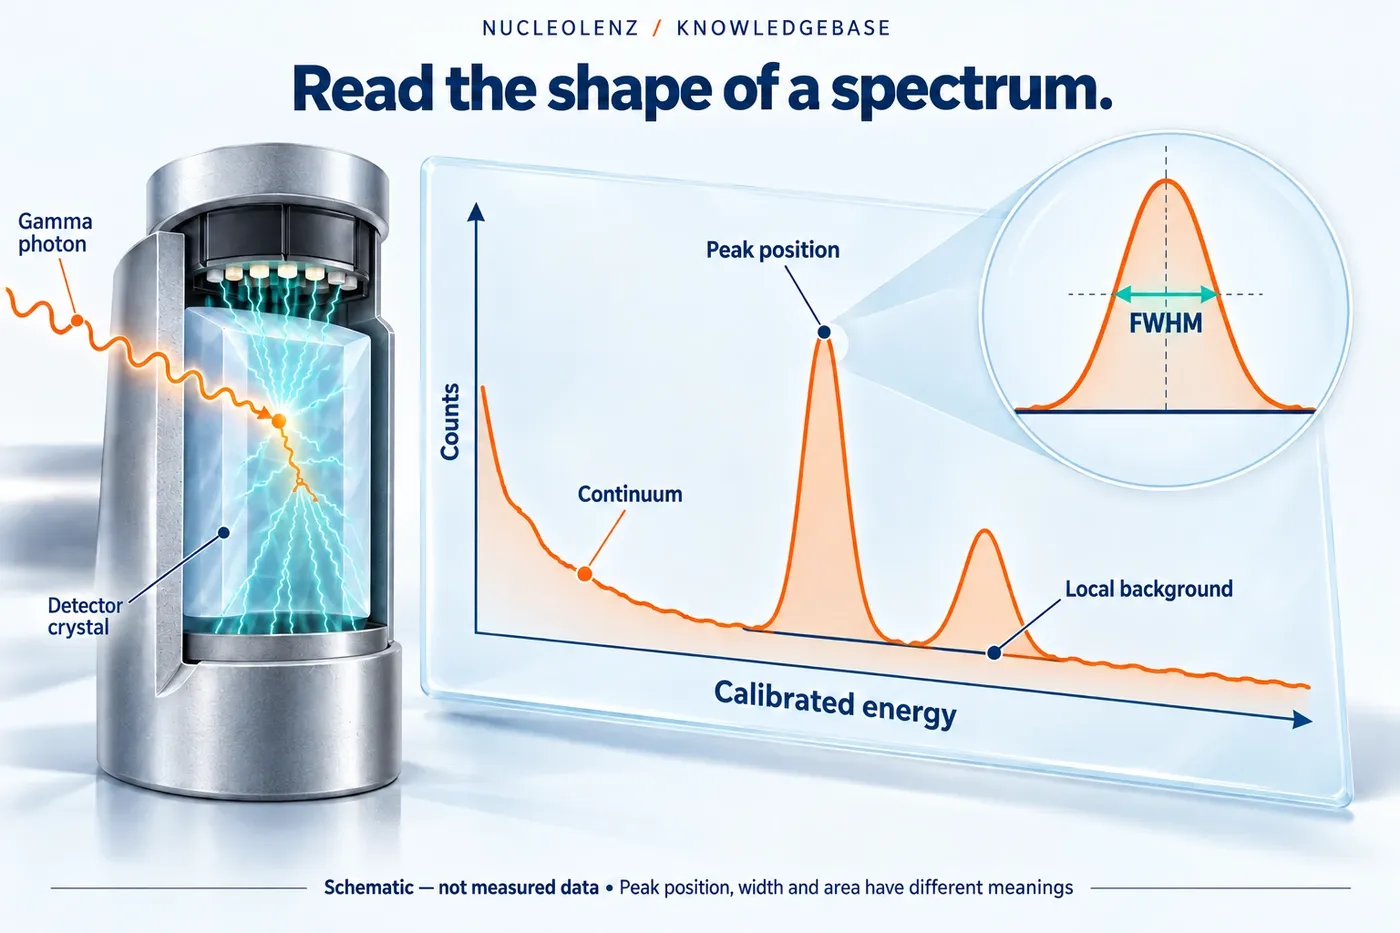
Open the concept graphic at full size ↗
Three key ideas
Read the axes before naming the peaks
- Axes: Channel or energy; counts or normalized rate.
- Features: Describe peaks and continuum with acquisition context.
- Evidence: Check calibration, background and analysis.
At a glance
A practical comparison
| Observation | What it tells you | What else you need |
|---|---|---|
| Peak position | An energy-related feature after calibration | Energy calibration and identification evidence |
| Peak width | How broadly a feature is represented | Energy, detector response and fitting method |
| Net peak area | Events attributed to the selected feature | Background treatment and acquisition time |
| Activity result | A quantitative interpretation of spectral data | Efficiency calibration and measurement geometry |
Educational comparison; apply the method specified for the instrument and task.
A gamma spectrum is a structured measurement, not a picture whose highest feature supplies the entire answer. Start by understanding the axes and the conditions under which the data were acquired.
Check the axes before the features
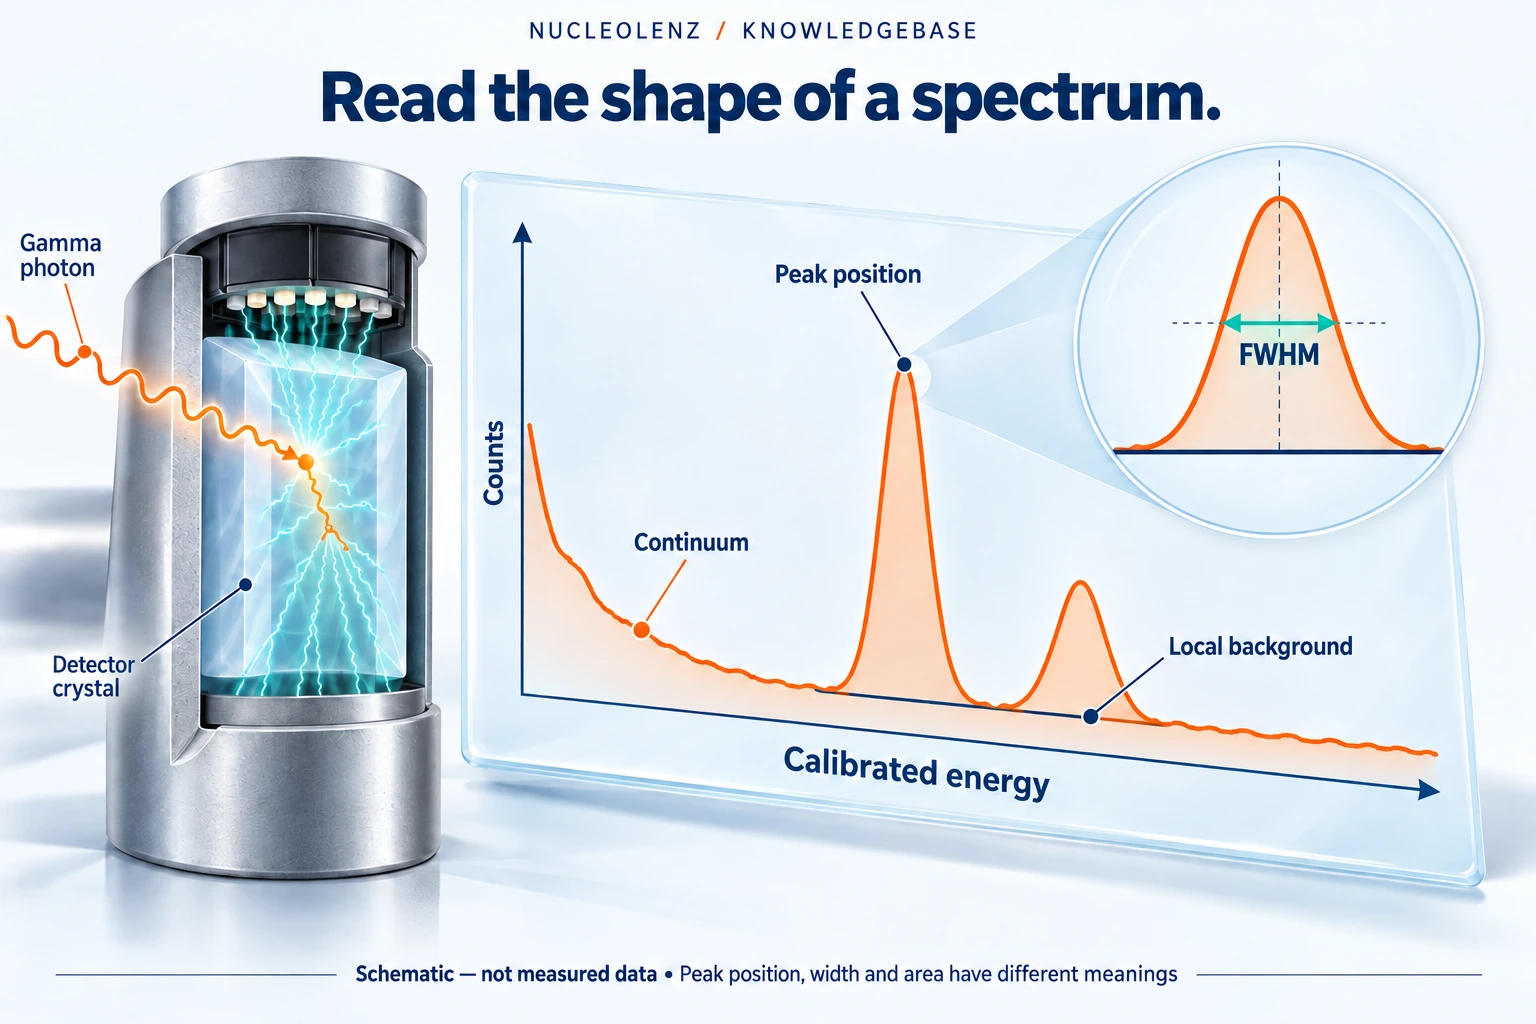
The horizontal axis may show channel number or calibrated energy, often in keV. The vertical axis may show counts per channel or another normalized quantity. Record which representation is being displayed and whether any processing has been applied.
Also inspect acquisition time and the available instrument status. Two screenshots can look different because their measurement durations or display scales differ, even when the underlying situations are similar.
Distinguish peaks from the rest of the spectrum
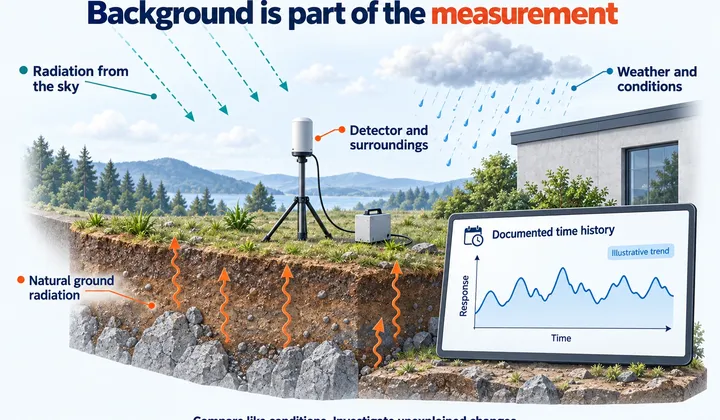
A full-energy peak corresponds to events depositing the relevant photon energy in the detector. A spectrum can also include a continuum and background contributions. Not every feature is a new radionuclide, and not every photon produces a full-energy event.
Keep interpretation tied to the method
Review energy calibration, resolution and background before assigning a feature. Where radionuclide identification is intended, consider the relevant lines and the validated analysis rather than relying on visual resemblance to an internet image.
The Nucleolenz GS200 provides a product context for gamma spectroscopy. Its model-specific instructions and configured analysis should guide operation; a general spectrum guide does not establish an activity-measurement method.
Save the spectrum in the supported data format together with the acquisition settings and sample geometry. That record allows a later reviewer to evaluate the same evidence. A beginner's first useful achievement is describing what the plot shows and what remains unknown, before making a confident identification.
Read a plot in four passes
- Labels: Identify the horizontal and vertical quantities. Channel 600 is not necessarily 600 keV.
- Acquisition: Read the time, detector configuration and sample or field description.
- Features: Describe peak positions, widths and the surrounding continuum before assigning a cause.
- Interpretation: Check what calibration, background and analysis support the proposed conclusion.
The distinction between position and area is particularly useful. Peak position relates to energy when an appropriate calibration is applied. A net peak area estimates the events attributed to that peak using an analysis that accounts for the underlying contribution. Turning that area into activity requires further information. Peak height alone also depends on width and display binning, so the tallest feature is not automatically the largest activity.
A fictional screenshot review
A colleague sends a spectrum image with a visible peak near channel 400 and asks which radionuclide it shows. The screenshot has no energy calibration, acquisition duration or background information. The useful answer is a request for those records and the original spectral file. Naming a radionuclide from the channel number would attach more meaning to the image than it contains.
Next, the colleague supplies a calibrated energy axis but the spectrum has very few counts. The plot is now better described, yet the confidence of an identification remains a separate question. Check the relevant lines, detector resolution and analysis method rather than treating the new axis label as confirmation.
Save enough to revisit the interpretation
Retain the original spectrum, live and elapsed times where available, calibration references and processing settings. State whether background subtraction, smoothing or normalization was applied. A processed image can communicate a result, while the underlying data allow someone else to examine how that result was obtained.
Check your understanding
Put the idea to work
Choose an answer, then reveal the explanation. Your answers stay in this browser.