
Energy Resolution in Gamma Spectroscopy: Why Peak Width Matters
Understand FWHM, relative energy resolution and why a smaller percentage needs context. Compare peak width separately from energy calibration and detection efficiency.
Open the concept graphic at full size ↗
Three key ideas
Three spectroscopy questions, three meanings
- Calibration: Where does the peak fall on the energy axis?
- Resolution: How wide is the peak at a stated energy?
- Efficiency: How many relevant emissions are detected?
At a glance
A practical comparison
| Observation | What it tells you | What else you need |
|---|---|---|
| Energy calibration | Relationship between channel and energy | Calibration evidence across the relevant range |
| Energy resolution | Peak width at a stated reference energy | FWHM, method and acquisition conditions |
| Detection efficiency | Response to relevant emissions in a defined setup | Geometry and appropriate efficiency calibration |
Educational comparison; apply the method specified for the instrument and task.
Closely spaced gamma features can become difficult to separate when their peaks are broad. Energy resolution describes this ability to distinguish nearby energies, but it is only one part of spectroscopy performance.
Describe the width at a defined energy
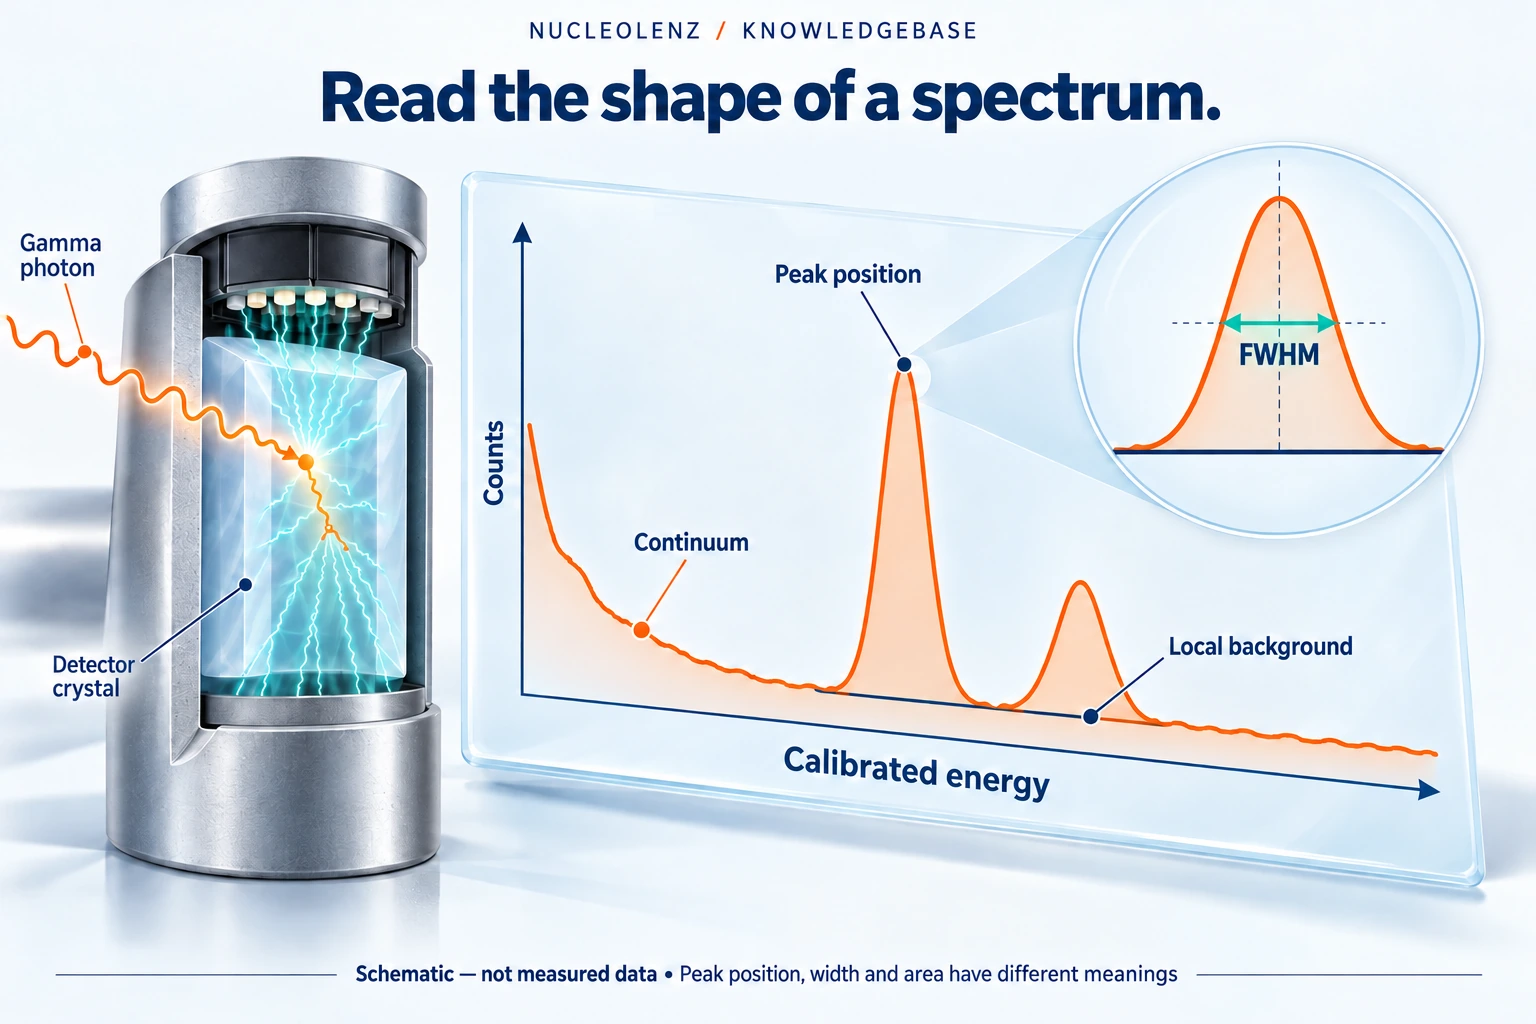
A commonly reported measure is full width at half maximum, or FWHM: the width of a peak at half its maximum height. Relative resolution is the width divided by the peak energy, often expressed as a percentage.
For a purely synthetic arithmetic example, a 40 keV FWHM at 600 keV gives approximately 6.7 percent. This example is not a specification or test result for any Nucleolenz detector. A comparison must use the stated energy, method and acquisition conditions.
Separate different performance questions
Energy calibration concerns the relationship between channel and energy. Resolution concerns how narrowly a feature is represented. Efficiency concerns the relationship between emissions and detected events for a defined measurement. Improving one does not automatically establish the others.
Counting statistics, processing settings and detector characteristics can affect the ability to evaluate a peak. A short acquisition with few events may not support a reliable width estimate even when the detector has good resolution under suitable test conditions.
Specify what the application requires
Ask which spectral features need to be distinguished and in what sample or field conditions. A task involving mixed radionuclides can impose a different requirement from one following a broad spectral change. State the relevant energy region and expected analysis, rather than asking for the smallest percentage without context.
When considering a Nucleolenz GS200, request the resolution evidence applicable to the supplied configuration. Do not substitute an illustrative peak drawing for a measured specification.
A useful comparison preserves the detector, reference energy, settings, counting conditions and analysis method. That makes peak width a meaningful part of the selection discussion rather than a number detached from the measurement problem.
Compare like with like
In a fictional specification exercise, system A reports 6% resolution and system B reports 4%. The reference energies and detector configurations have been removed. The percentages alone do not support a fair ranking. Ask for the energy at which each width was measured, the relevant detector and the test conditions before deciding which result addresses the application.
For an isolated peak, half maximum refers to the peak above its underlying background or continuum as treated by the chosen analysis. A raw cursor width measured halfway up a plot with a raised baseline may not be the same quantity. State the fitting or evaluation method, particularly when peaks overlap or the data contain few events.
Why narrower peaks can help
When nearby energy contributions produce broad, overlapping features, separating their contributions becomes harder. Narrower peaks may make the distinction clearer under suitable counting and analysis conditions. There is no universal rule that two lines are always resolved whenever their separation exceeds one quoted width: relative intensities, background, counting statistics and the method also matter.
This is why the application should name the features it needs to distinguish. A requirement to follow a broad change in a spectrum is different from a requirement to evaluate two nearby, unequal peaks in a mixture.
A useful evidence request
- Identify the supplied detector and the reference energy or energies.
- Request the measured FWHM, its units and the method used to evaluate it.
- Keep acquisition settings, conditions and the supporting spectrum with the result.
- Assess the resolution alongside efficiency, stability and the intended analysis.
Longer counting can improve the evidence available for estimating peak width; it does not automatically change the detector's intrinsic energy resolution. Likewise, correcting an energy-axis offset does not by itself narrow a broad peak. Treat these as separate performance questions when reviewing a test report.
Check your understanding
Put the idea to work
Choose an answer, then reveal the explanation. Your answers stay in this browser.