
Dose and Dose Rate: Reading the Total and the Rate
Learn how dose differs from dose rate, follow a worked time calculation, and record the quantity, interval and reset history needed to interpret each display.
Open the concept graphic at full size ↗
Three key ideas
Total and rate answer different questions
- Dose: Accumulated over a stated interval.
- Dose rate: How quickly the quantity accumulates.
- Time history: Connect changing rates to the total.
At a glance
A practical comparison
| Observation | What it tells you | What else you need |
|---|---|---|
| µSv | An accumulated dose-equivalent quantity | Quantity definition, start and end times |
| µSv/h | A dose-equivalent rate | Quantity definition and averaging interval |
| A calculated task total | A result based on rate and time | Representative rates and stated assumptions |
Educational comparison; apply the method specified for the instrument and task.
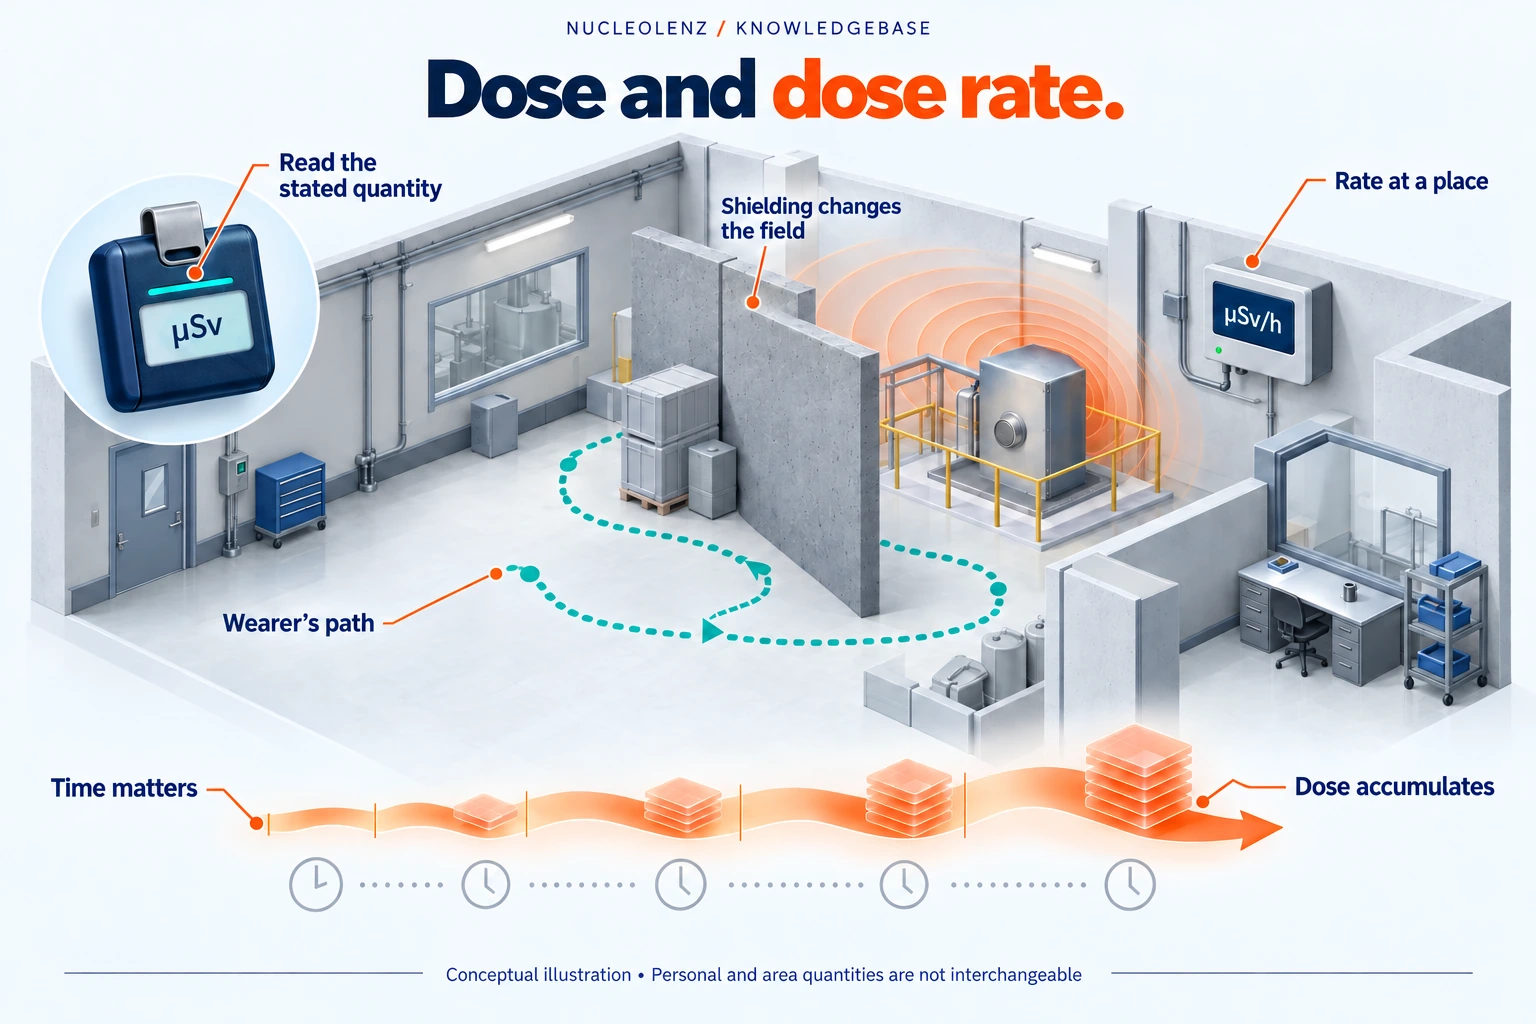
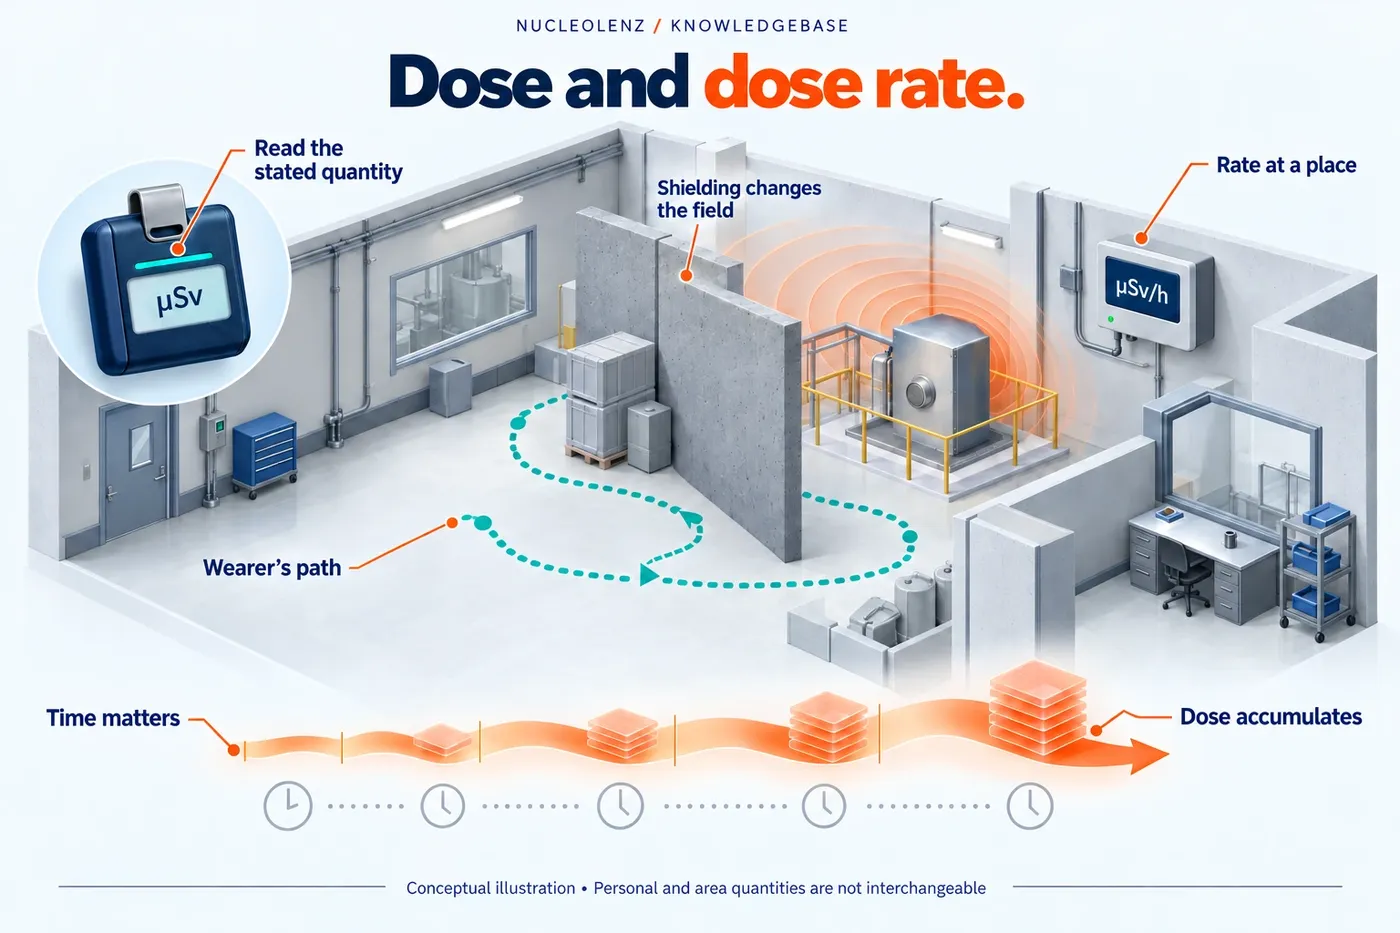
Two radiation displays can show related information while answering different questions. One tells you about an accumulated quantity; the other describes how quickly that quantity is accumulating under the current conditions.
Read the unit before the number
A dose display may use microsieverts, written µSv. A dose-rate display may use microsieverts per hour, written µSv/h. The “per hour” changes the meaning. Before interpreting either number, establish the dosimetric quantity the instrument reports and the conditions for which it is calibrated.
A changing rate does not erase dose already accumulated. Equally, a cumulative reading does not identify the highest rate encountered during a task. Both records can be useful, but neither should be substituted for the other without understanding the measurement.
Use a simple calculation carefully
For a purely illustrative calculation, suppose an appropriate instrument reports a constant rate of 2 µSv/h for 15 minutes. The corresponding increase is 2 multiplied by 0.25 hours, or 0.5 µSv. This example explains units; it is not a safety limit or permission to undertake an exposure.
Real work can involve changing positions, shielding and source conditions. In that situation, multiplying a single spot reading by the whole shift can give a misleading estimate. A representative time history or an appropriate personal measurement is needed for the intended assessment.
Keep the record interpretable
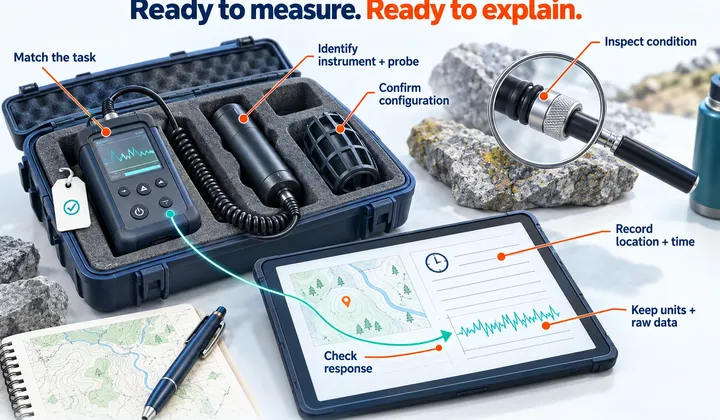
Note the start and end times, whether an accumulated display was reset, the instrument identity and any changes in working conditions. When reviewing a trend, ask whether the instrument's response time could smooth a short event.
Nucleolenz's Teledosimeter is described as providing cumulative dose and dose-rate readings. Its two displays should be explained separately during operator training. Confirm the particular configuration, calibration quantity and site requirements before using a record in a radiation protection assessment.
A useful review question is: “Does this number describe what has accumulated, or the rate at the moment of measurement?” Answering that question first prevents many avoidable reporting errors.
A worked example with two time intervals
Consider a fictional exercise in which the same suitable instrument remains in a defined field. It reports 2 µSv/h for the first 15 minutes and 3 µSv/h for the next 15 minutes. Assume the rate is constant within each interval and that both readings refer to the same supported quantity. The increments are 0.5 µSv and 0.75 µSv, giving a total increase of 1.25 µSv.
Using only the final rate for the full half-hour would give 1.5 µSv. Using only the first would give 1 µSv. Neither calculation describes the fictional history. The useful step is to divide the record where the conditions changed, then add the contributions. These numbers illustrate arithmetic; they are not exposure targets or permitted working times.
Three display details worth checking
- Accumulation interval: Does the total refer to this task, today's shift or the period since the last reset? A starting reading and an ending reading may be needed.
- Rate update: Does the display average over a recent interval? A displayed maximum and an instantaneous-looking value may use different processing.
- Measured quantity: A unit containing sieverts does not alone identify the calibration quantity. Keep the manufacturer's quantity definition with the record.
If a device is switched off, reset or loses data during a task, mark that interval explicitly. A missing interval cannot be reconstructed merely by extending the last available reading. Keep the original displayed values alongside any calculation so that a reviewer can distinguish the instrument record from assumptions added later.
Check your understanding
Put the idea to work
Choose an answer, then reveal the explanation. Your answers stay in this browser.