
Count Rate or Gamma Spectrum: What Each Result Can Tell You
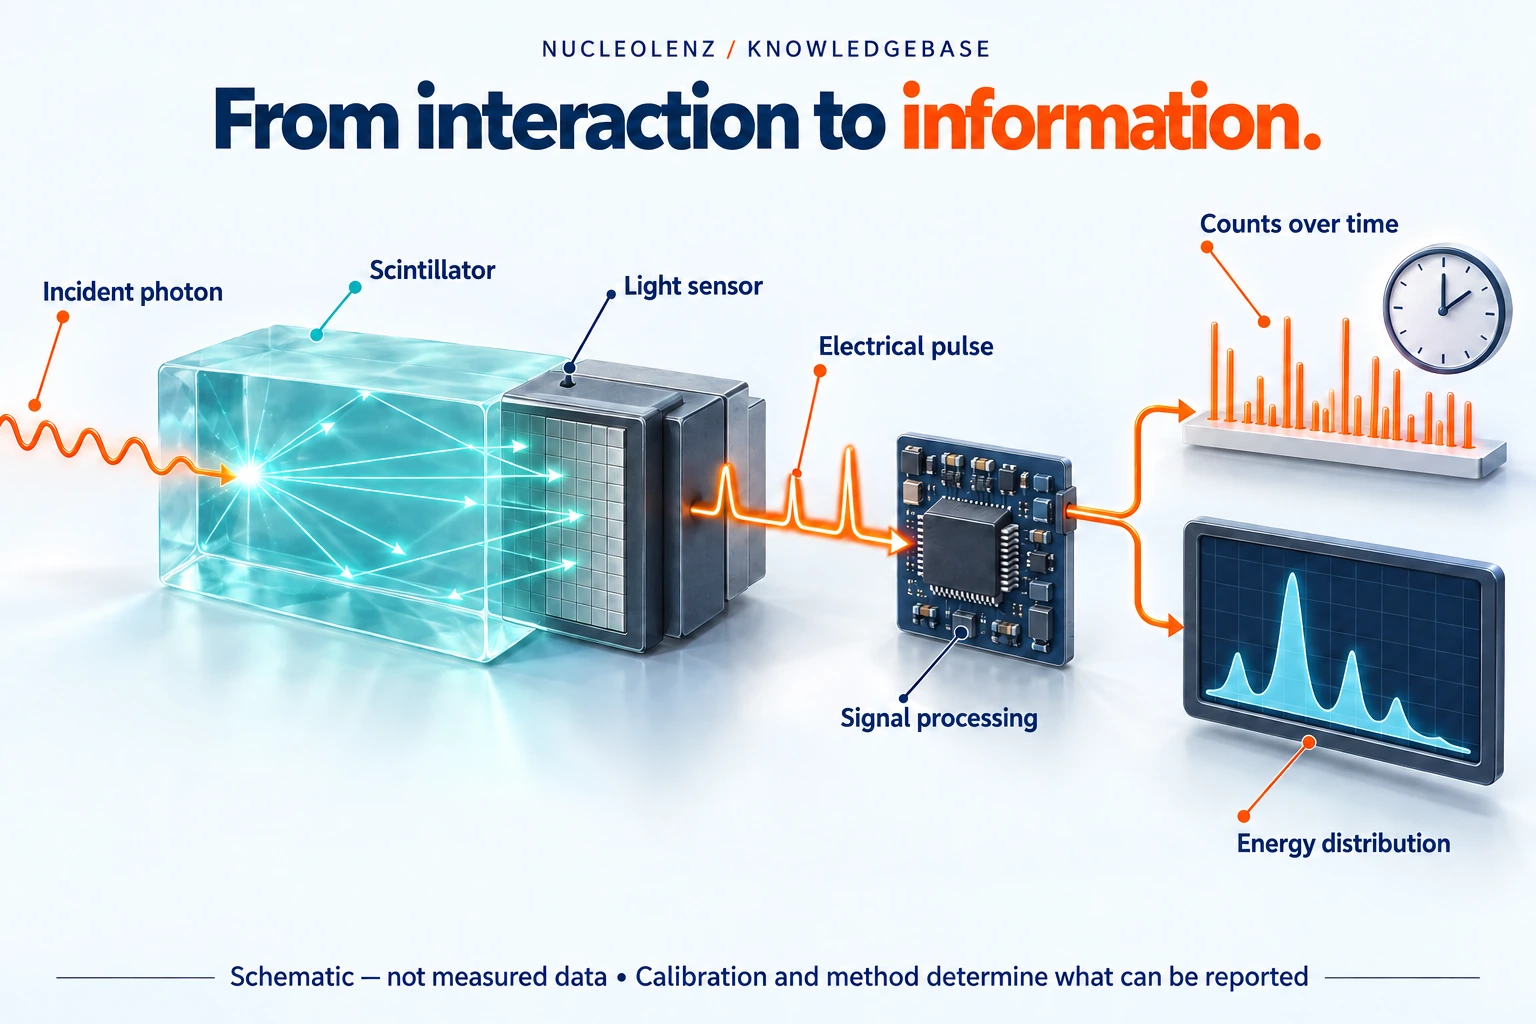
A count rate reports accepted events per time; a gamma spectrum preserves their energy distribution. Learn which evidence supports a trend, identification or quantitative assay.
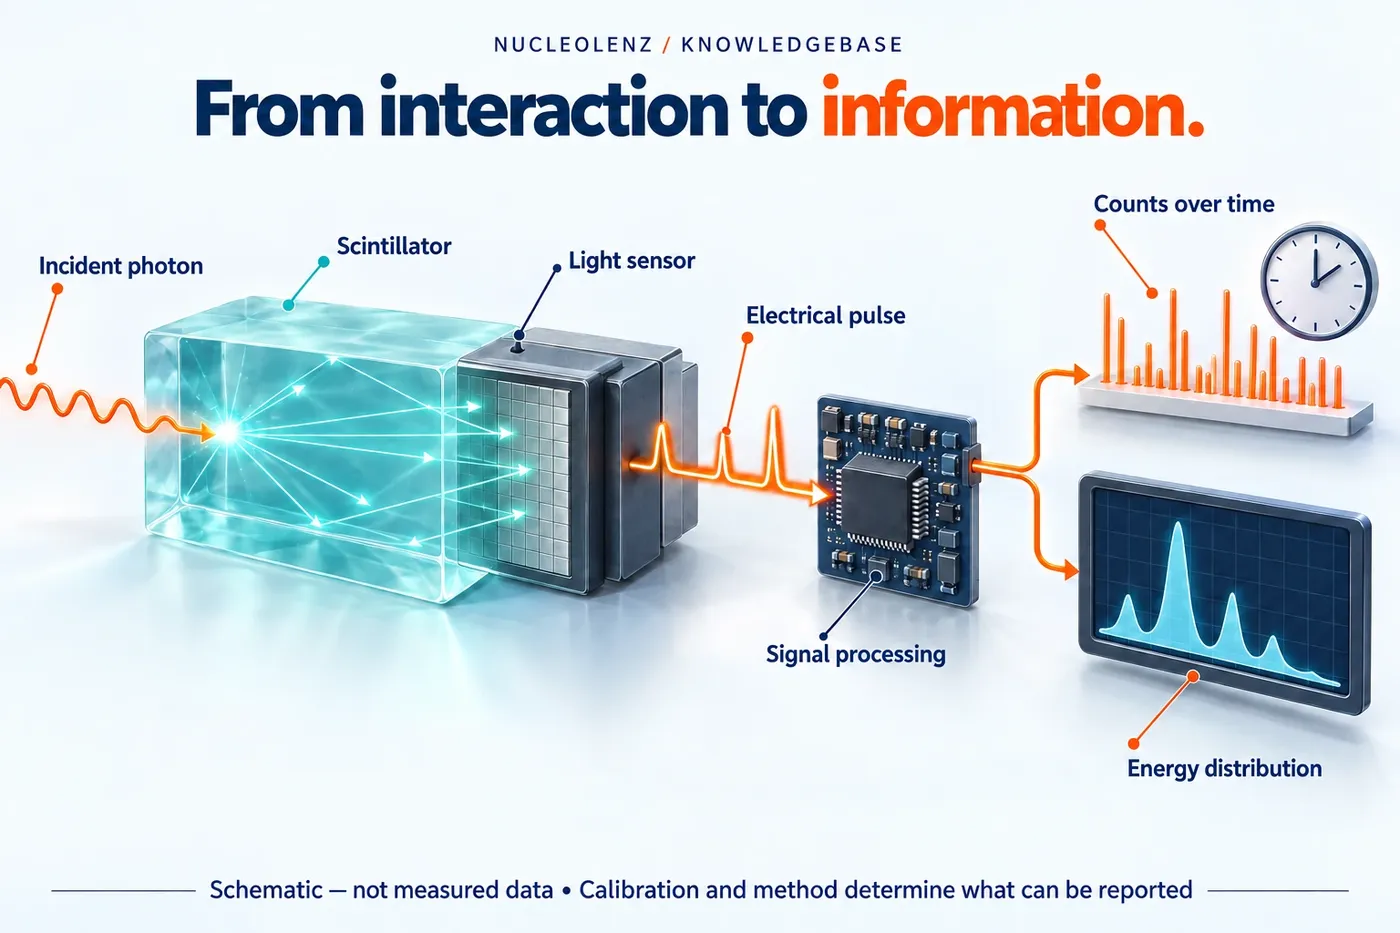
Open the concept graphic at full size ↗
Three key ideas
Choose the result for the question
- Count rate: Accepted events per unit time.
- Spectrum: Events distributed across energy channels.
- Assessment: Calibration and method support the final claim.
At a glance
A practical comparison
| Observation | What it tells you | What else you need |
|---|---|---|
| Count rate | The rate of accepted detector events | Settings, duration and comparison conditions |
| Gamma spectrum | The distribution of accepted events by channel or energy | Energy calibration, background and response |
| Quantified activity | A result obtained with a specified analysis method | Efficiency, geometry, timing and uncertainty |
Educational comparison; apply the method specified for the instrument and task.
Two measurements can register the same total number of events while having different energy distributions. A single count rate compresses information that a spectrum can preserve.
Understand the compressed view
A count rate describes accepted detector events per time under the selected settings. It can help follow changes or compare defined arrangements. It does not, by itself, identify the radionuclides responsible for those events.
Read the distribution with its conditions
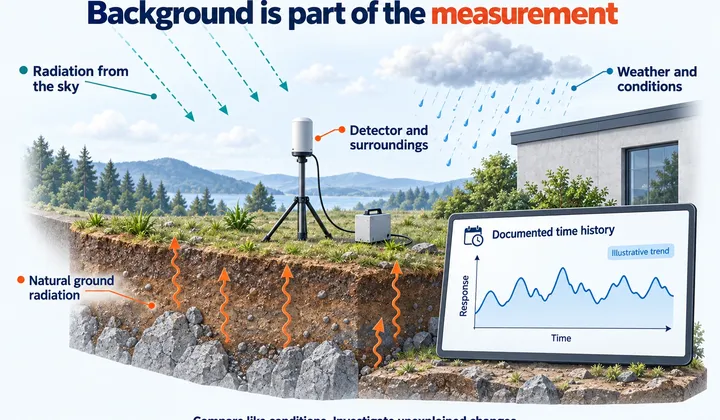
A gamma spectrum displays how detected events are distributed across channels or calibrated energies. Peaks and broader features can support analysis when the detector response, energy calibration, background and acquisition conditions are understood.
Identification should not rely on the tallest peak alone. Mixed sources, overlapping features and incomplete energy deposition can complicate interpretation. A software label is a result to assess within the validated method, not a substitute for the underlying evidence.
Choose the output that fits the decision
If the task is to investigate a change, a count trend may provide an initial observation. If the question concerns gamma-emitting radionuclides, suitable spectral information may be needed. Quantifying activity adds further requirements, including the appropriate efficiency calibration and sample arrangement.
The Nucleolenz GS200 gamma spectrometer is described with a multichannel analyzer and isotope-identification function. Confirm the exact configuration and analysis scope when defining a project requirement.
Keep the original spectrum and acquisition metadata when they are part of the investigation. A screenshot of a total cannot recover the distribution later. Selecting the right result at the start helps avoid collecting an answer to a simpler question than the one the project actually needs to resolve.
Equal totals can hide different patterns
Imagine two synthetic teaching datasets divided into three broad energy regions. The first contains 30, 60 and 10 accepted events; the second contains 10, 60 and 30. Each total is 100 events. If their acquisition durations and settings match, their overall count rates are equal, yet the distributions differ. The three regions are invented for this exercise and cannot identify any radionuclide.
That distinction explains why a total count is useful for some tasks but insufficient for others. The total answers how many events were accepted. A spectrum adds information about where those events fall in the detector's energy response. Neither result alone establishes all the properties of the source or sample.
Move from observation to claim in stages
- Change detection: Compare a trend under documented, sufficiently consistent conditions.
- Radionuclide assessment: Examine calibrated spectral features and the relevant background through the appropriate identification method.
- Activity measurement: Add the efficiency, emission data, timing corrections and geometry required for the intended quantitative result.
Each stage introduces additional evidence. A clear peak is not automatically an activity concentration. A sample's mass, distribution and attenuation can affect an assay, while a field spectrum may contain contributions from several directions. A software result should retain its acquisition and analysis record so the interpretation can be reviewed.
Ask for the data you will need later
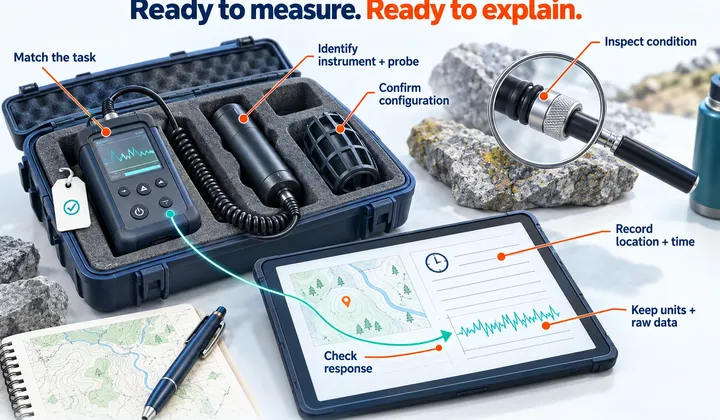
Before a project starts, agree whether it needs a rate log, full spectra or both. Define the supported export format and metadata, including acquisition duration, settings and calibration reference. A photograph of a total display cannot be expanded into an energy distribution after the fact. Keeping the relevant raw data gives the reviewer a chance to test an explanation when the original question changes.
Check your understanding
Put the idea to work
Choose an answer, then reveal the explanation. Your answers stay in this browser.