
From a Detector Signal to a Radiation Reading
How does a radiation interaction become a count, spectrum or dose-rate reading? Follow the measurement chain and learn which information each output retains.
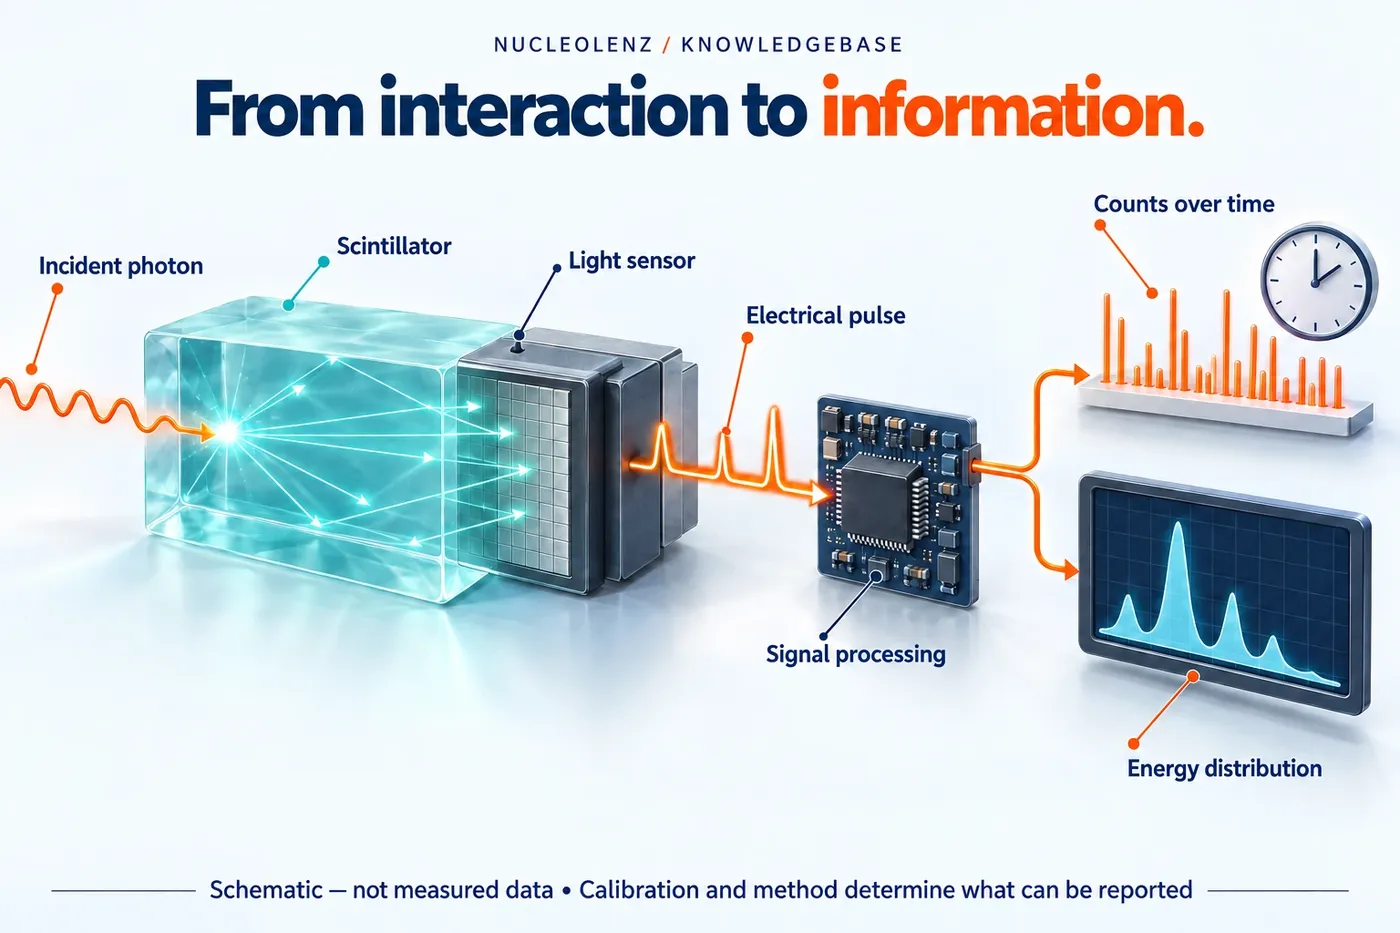
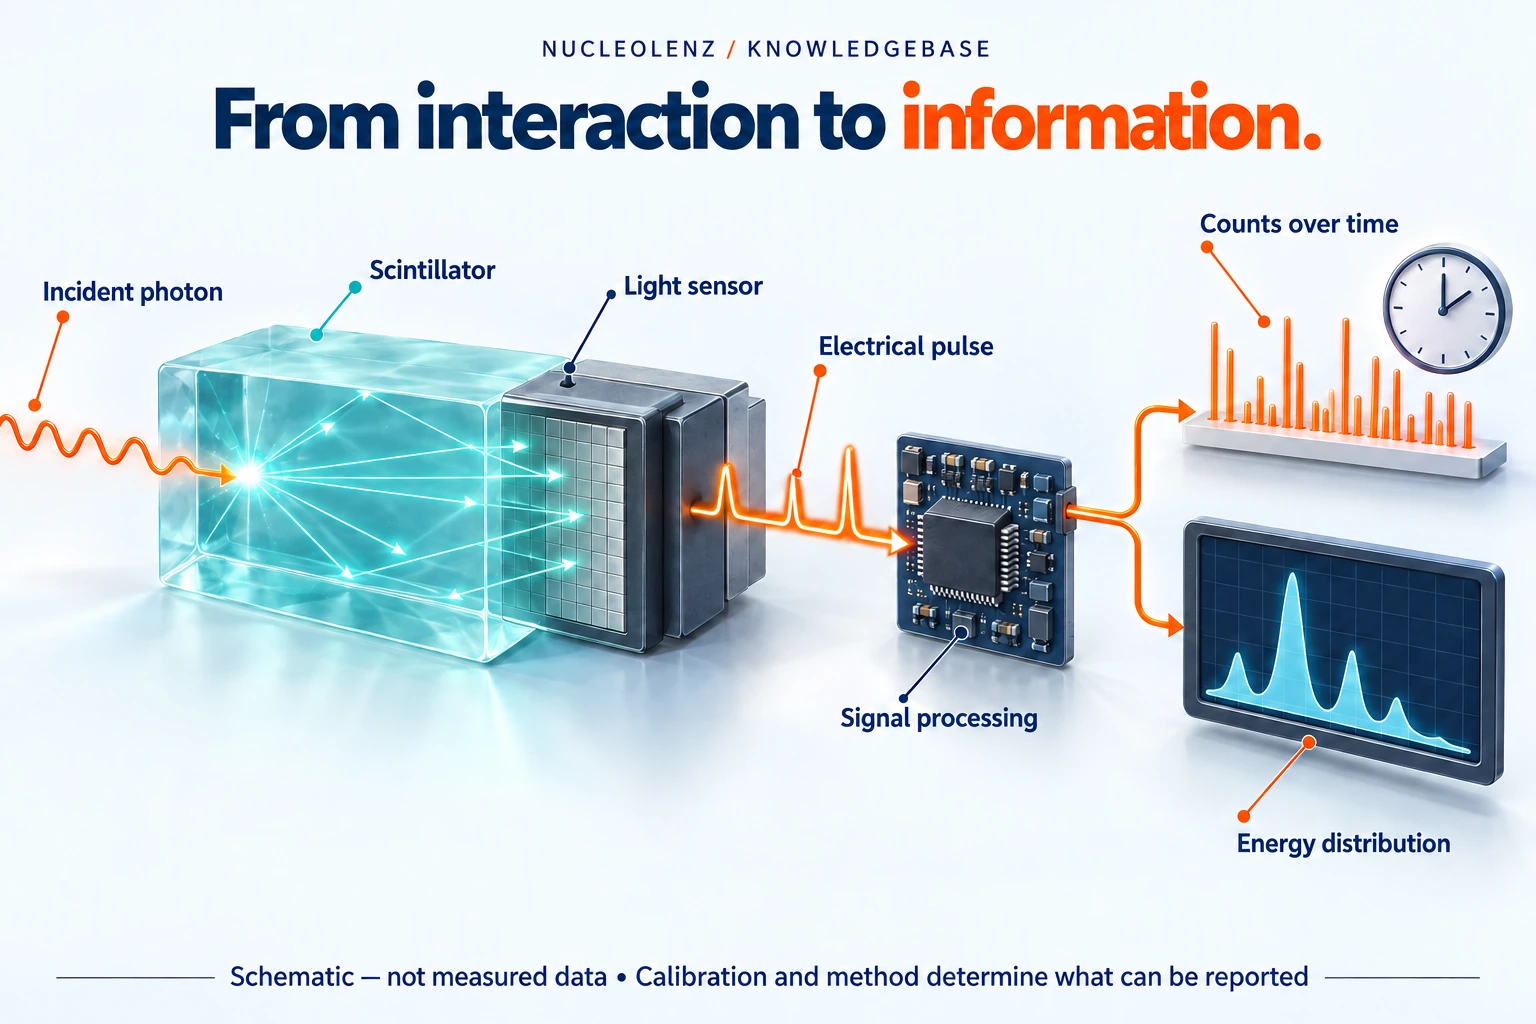
Open the concept graphic at full size ↗
Three key ideas
Interaction becomes information
- Interaction: Radiation deposits energy in a suitable detector.
- Accepted signal: Electronics and settings determine what is recorded.
- Reported result: Calibration and analysis connect data to a stated quantity.
At a glance
Compare the key distinctions
| Focus | What it establishes or needs | Important limit or evidence |
|---|---|---|
| Total counts | Accepted events during acquisition | Does not preserve an energy distribution |
| Count rate | Events per unit counting time | Is not automatically activity or dose rate |
| Gamma spectrum | Counts distributed by energy or channel | Needs calibration and analysis for interpretation |
| Dose-rate indication | A characterized dose quantity per time | Depends on supported radiation response |
These are distinct measurement roles; suitability depends on the complete method.
A radiation display is the end of a chain of physical interactions and configured processing. Understanding that chain helps explain why a raw count, a spectrum and a dose-rate indication are different outputs.
Begin with a detectable interaction
A detector responds when an appropriate interaction produces a signal in its sensitive material. The signal depends on the detector technology and the radiation reaching it. Not every emitted particle or photon produces a registered event.
The arrangement matters: material between the source and detector, distance and detector response can change which events are observed. That is why the measurement system includes geometry as well as hardware.
Process the information for the intended output
Electronics can condition signals and distinguish useful events from unwanted noise. A counting system accumulates accepted events over an interval. A spectroscopy system sorts suitable signals into channels associated with energy information, using the configured acquisition and calibration.
The Nucleolenz GS200 is described as using a NaI(Tl) detector and a multichannel analyzer. That is an example of an instrument designed to provide more information than an undifferentiated stream of counts. The exact processing and operating instructions depend on the supplied system.
Interpret the displayed quantity
Turning counts into another quantity requires an appropriate response relationship and calibration. A displayed dose rate is not simply a raw count rate with a different unit label. Likewise, an energy calibration alone is not enough to establish a sample activity.
Read three displays without confusing them
A counter can report how many accepted events occurred during a stated interval. Dividing by the appropriate counting time gives a count rate. A spectrometer retains additional information by grouping pulses according to measured pulse size and, with an energy calibration, displaying an energy distribution. A dose-rate instrument uses a characterized response to indicate its stated radiation-protection quantity.
The screen is therefore a description of processed information. Changing a label from “counts” to “dose” cannot create the response characterization that a dose measurement needs. Equally, dividing counts by sample mass does not produce a valid activity concentration without the necessary calibration, corrections and sample method.
An unexpected reading: begin with the record
In a fictional classroom exercise, two groups record the same number of counts but use different acquisition times. Their totals match; their rates do not. A second pair uses the same time but different source-to-detector arrangements. Their difference cannot be interpreted from time alone. These deliberately simple cases show why a dataset must describe both acquisition and geometry.
Before changing settings, preserve the original data and note the detector identity, selected mode, time basis, relevant calibration and arrangement. Then state which part of the chain is being investigated. This helps distinguish a question about what reached the detector from a question about how accepted signals were processed.
What information was discarded?
A single total count cannot usually reconstruct a gamma spectrum. It no longer says how the accepted signals were distributed by energy. A spectrum, in turn, does not automatically reveal the activity of an unknown sample: the efficiency, geometry, background and analysis still matter.
Ask for the least processed useful dataset alongside the reported result when the workflow supports it. Keep its metadata and the analysis settings together. This allows a reviewer to distinguish a new interpretation of existing observations from a new measurement. The central habit is to follow the result upstream until its assumptions are visible.
When a reading is unexpected, investigate the chain systematically: arrangement, detector, electronics, settings, calibration and interpretation. Changing the display without understanding the upstream information can hide the cause. A useful instrument record makes the complete chain visible to the person reviewing the result.
Check your understanding
Put the idea to work
Choose an answer, then reveal the explanation. Your answers stay in this browser.